Airscan launches Air Quality Campaign in Brussels

From the 1st to the 14th of February, Airscan launched an air quality campaign in Brussels. For two weeks, air quality was measured at 8 different locations in the same number of municipalities of the capital. With this campaign, Airscan wants to shed light on the importance of clean air, especially in a busy city such as Brussels.

Online Airscan Platform

Exposure to pollution was the cause of 6.7 million premature deaths worldwide in 2019 according to the WHO. Furthermore, figures estimate that over half the world population lives in urban settings today, and this number will increase to 68% of the population by 2050. It is therefore crucial to make sure the air we breathe in our cities is as clean as possible.


During this campaign, Airscan measured air quality through sensors installed all over Brussels during a period of fourteen days, one sample was taken every ten minutes and communicated to the Airscan cloud platform. This campaign focused on PM2.5, PM10 and NO2.

results of eight air quality sensors places all over Brussels

Image 1: Results of the Air Quality Campaign in Brussels

Centre of Brussels and Koekelberg among most polluted areas

The results show that the sensor placed close to Central Station in the Centre of Brussels and Simonis in Koekelberg recorded the highest levels of pollution, followed by the sensor placed close to Bockstael in Laeken. On these locations, average NO2 concentrations were three times higher than the WHO air quality guidelines with peaks going up to 40ppb.

The sensors in Watermael-Boitsfort and Etterbeek registered the lowest NO2-concentrations with averages around 3ppb and peaks not exceeding 25ppb.

Morning and evening spikes clearly visible

Although different concentrations were recorded from one municipality to another, the same pattern appeared at each of them: regular morning and evening spikes. Between 6am and 9am and again between 4pm and 7pm, spikes in NO2  are clearly visible. Regarding PM2.5 and PM10, the concentration is relatively stable throughout the day and starts rising from 4pm.


Transportation accounts for 48% of NO2-emissions, which explains the morning and evening spikes and reinforces the need for cleaner and more sustainable transport in a city such as Brussels. The evening spikes in PM could also be linked to heating of households, which in its turn shows the importance of insulating houses and buildings and making them more energy efficient.

Screenshot 2024 03 20 105737

Image 2: Results of PM2.5 and PM10 in the Centre of Brussels (Central Station area)

Screenshot 2024 03 20 105611

Image 3: Results of NO2 in Koekelberg, Simonis area

Conclusion

This short campaign sheds light on a problematic that still needs attention: air pollution in cities. Although pollution levels have decreased in the last years, the results show that pollution hotspots still exist and continuous efforts to bring pollution levels below WHO thresholds are necessary.

What are PM and NO2?

EU and WHO thresholds, sources and health effects or PM and NO2

Learned something?
Feel free to share.

Airscan partnerships
stephanie leblanc suTr28QV4wU unsplash

Ozone Levels In Brussels For The Last 10 Years

Did you know that the very air we breathe can be both a shield and a hazard? While ozone high up in the atmosphere protects us from the sun’s harmful rays, ground-level ozone can pose serious health risks. Airscan’s latest decade-long study reveals alarming trends in ozone levels across Brussels, with certain summer days seeing concentrations double the WHO’s recommended limit. Dive into our findings to understand how ozone impacts your environment and discover practical tips to protect yourself during high-pollution days..

Purecities Kunak AirPro

Pure Cities: how temperature, wind and rain shape our air

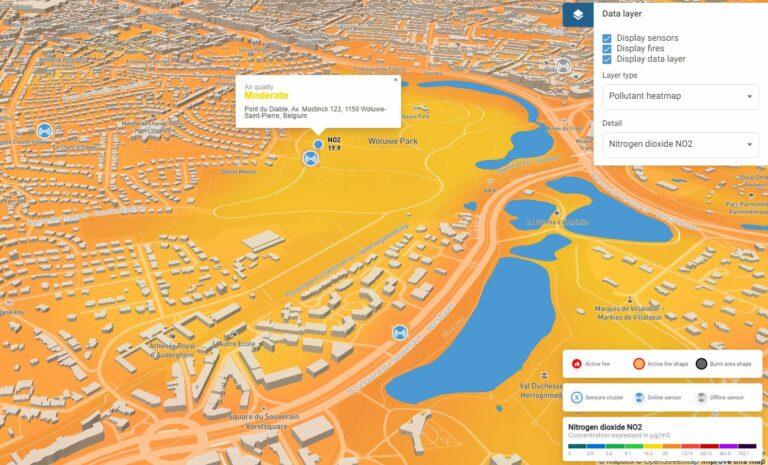
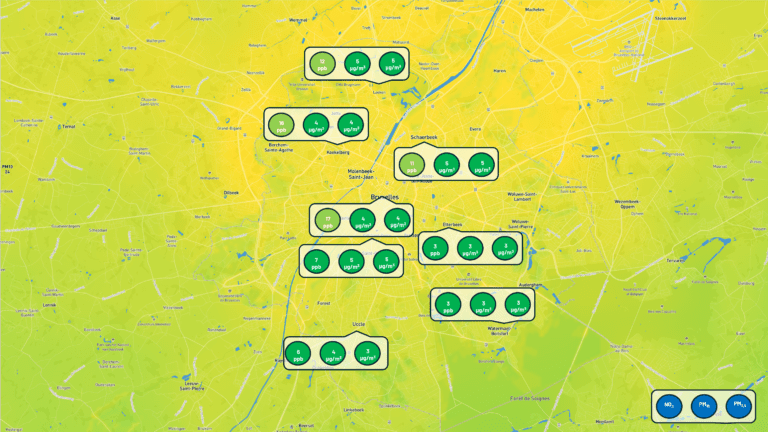
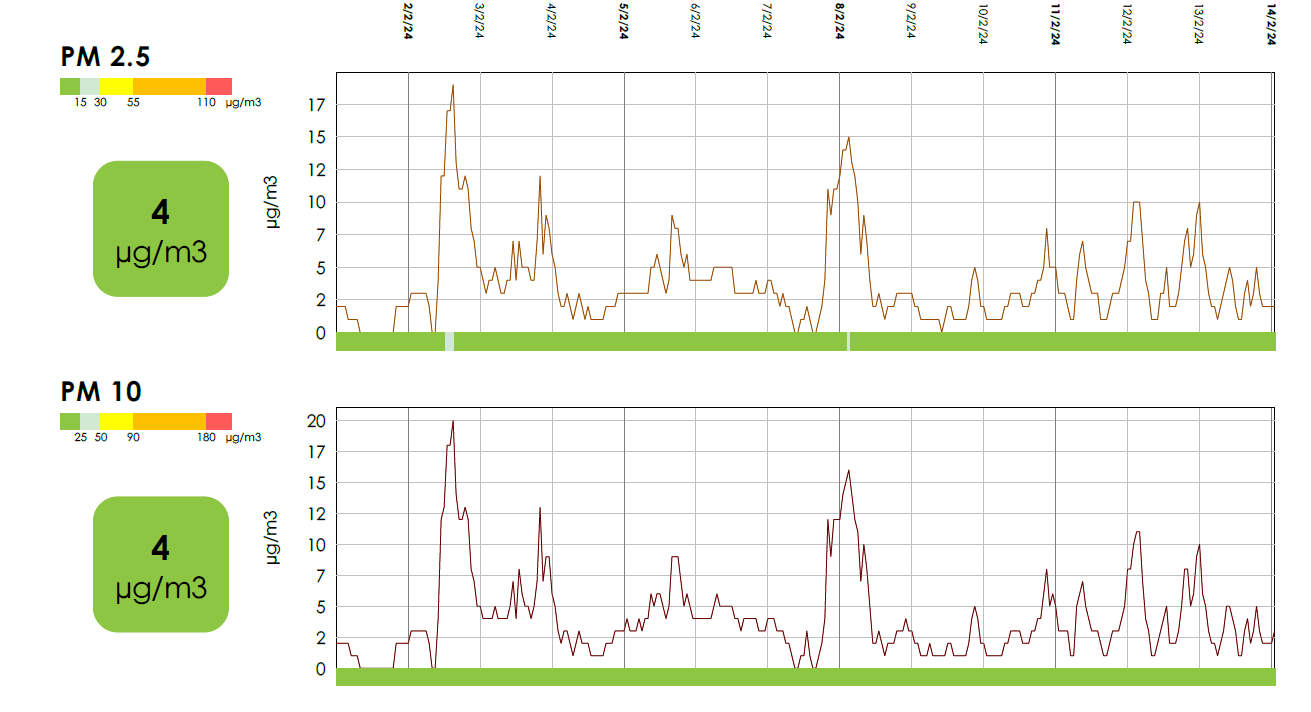
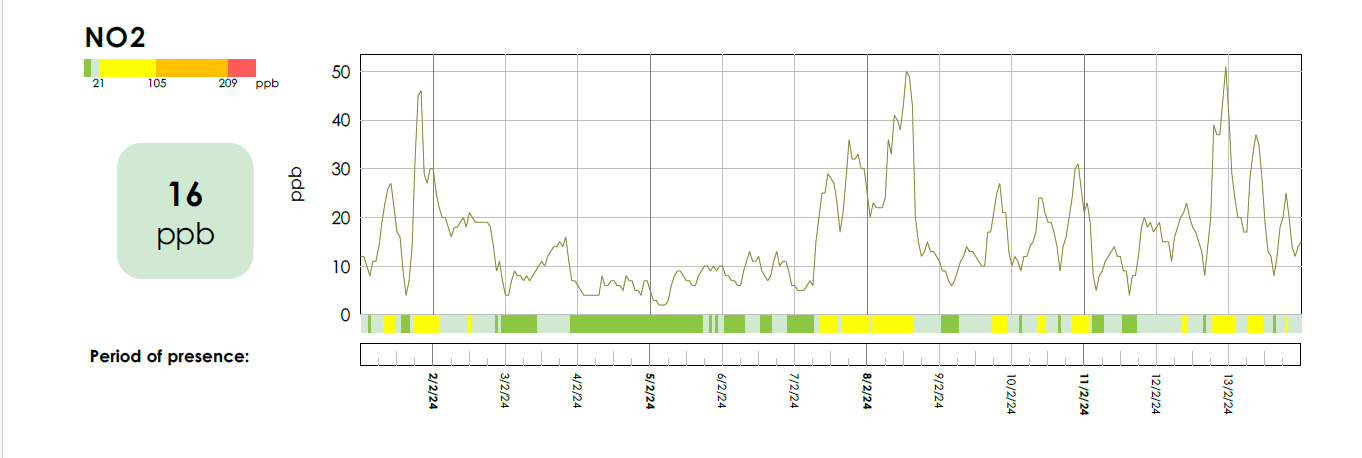
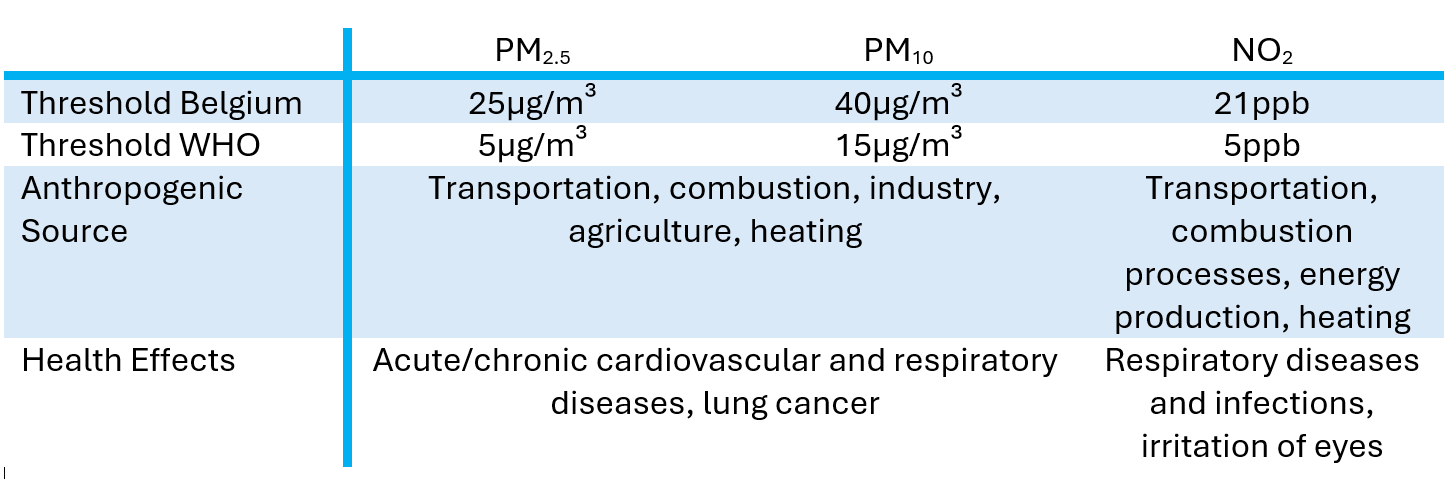
This article explores the seasonal variations in air pollution and the influence of meteorological factors on pollutant concentrations, focusing on data from the “Pure Cities” project in Belgium. Analyzing pollutants like PM2.5, PM10, and NO2, the study highlights how temperature, humidity, wind speed, atmospheric pressure, and precipitation affect air quality throughout the year. Findings show that pollutant levels tend to rise during colder months due to increased residential heating and reduced dispersion. The article discusses the importance of addressing seasonal pollution through targeted strategies, such as enhancing public transport, promoting green spaces, and aligning regulations with WHO guidelines.

Figure 1 2 1

Beats for Planet: Key Findings of 3 Years of Air Quality Monitoring in Belgian Schools

3 Years of Beats for Planet: this is what we know about air quality in Belgian schools! If you have been following Airscan for a while, you will definitely know Beats for Planet. Airscan launched this project with Belfius three years ago with the aim of helping schools improve their air quality. In the framework of this project, Airscan has collected and analyzed data from 72 schools around Belgium for three indoor pollutants: carbon dioxide (CO2), particulate matter (PM) and volatile organic compounds (VOC). This is what we found..